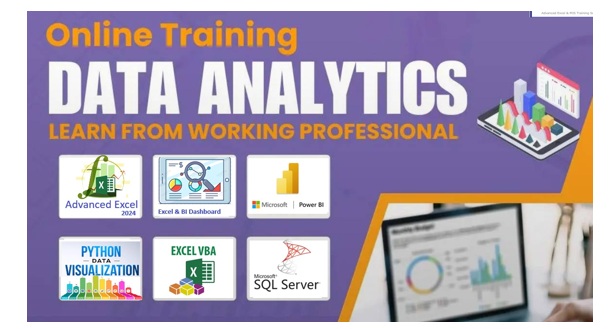
Complete Data Analysis Tools-Advanced Excel+VBA+ Power BI+SQL+Python+Dashboard
The Complete Data Analysis Tools package, which includes Advanced Excel, VBA, Power BI, SQL, Python, and Dashboard design, equips individuals with a strong foundation for data handling, automation, and visualization. Advanced Excel is essential for data entry, cleaning, and performing complex calculations using functions like VLOOKUP, INDEX-MATCH, and SUMIFS. It also offers powerful features like Pivot Tables and Power Query for summarizing and transforming large datasets. VBA (Visual Basic for Applications) enhances Excel by allowing automation of repetitive tasks, creation of user-defined functions, and development of custom forms and reports.
Power BI is a dynamic business intelligence tool that helps convert raw data into interactive dashboards and insightful visual reports, making it easier to track KPIs and business performance. SQL (Structured Query Language) is crucial for querying and managing data in relational databases, enabling analysts to extract exactly the data needed for further processing or analysis. Python adds powerful capabilities for advanced data analysis, statistical modeling, and automation, using libraries like Pandas, NumPy, and Matplotlib. Finally, Dashboard design brings all these tools together by focusing on visual storytelling—creating interactive, user-friendly dashboards that effectively communicate insights to stakeholders. Together, these tools form a comprehensive toolkit for any data professional aiming to analyze, automate, and visualize data effectively.
 Instructor Name - Sujit Kumar Singh
About this Course
The Complete Data Analysis Tools course from IPT Excel School is a comprehensive program designed to equip learners with the essential skills required to become proficient in data analysis and business intelligence. This course covers six powerful tools—Advanced Excel, VBA (Macros), Power BI, SQL, Python, and Dashboard Design—each selected to meet the real-world demands of data-driven industries.
In the Advanced Excel module, students master data handling, complex formulas, pivot tables, and Power Query, which are crucial for efficient data manipulation and reporting. The VBA segment focuses on automating repetitive tasks in Excel through macros, helping learners create dynamic reports and custom tools. The Power BI section teaches how to build interactive dashboards and visual reports, enabling better decision-making through data storytelling.
The SQL module trains students to retrieve, filter, and manage data from relational databases using practical queries. In the Python portion, learners explore data analysis using libraries like Pandas, NumPy, and Matplotlib, enhancing their ability to work with large datasets and perform advanced analytics. The final module, Dashboard Design, integrates knowledge from all previous tools, teaching students how to present insights clearly and professionally.
This course is ideal for students, professionals, and business owners who want to upskill in the field of data analytics. By the end of the program, participants will be able to confidently handle end-to-end data analysis tasks and create impactful reports using the most in-demand tools in the industry.
Skills you'll gain
Mastery of Advanced Excel Dashbaord Complete Power BI Data Analysis & Interpretation Data Visualization with Python VBA Macros & SQL Q Data Analysis with AISyllabus (Download PDF)
- Semantic HTML
- Semantic HTML
About the Instructor

MR. Sujit Kumar Singh
MIS & Data Analyst
4.87 Instructor rating
25K reviews
>1L Students
29 Live courses
In 2007, Sujit founded IPT Excel School, one of the pioneering institutes in New Delhi offering online live classes in Advanced Excel and MIS training. The institute caters to working professionals, providing courses that cover Advanced Excel, VBA Macros, Dashboard creation, and Power BI.
Sujit also maintains an active presence on platforms like YouTube and LinkedIn, where he shares tutorials and insights on Excel and related tools. His YouTube channel, Sujeet Kumar Advanced Excel Training in Hindi, offers a range of videos aimed at enhancing Excel proficiency.
For more information or to enroll in his courses, you can visit IPT Excel School's website or contact him directly at +91 8802579388.

3 Days Free DEMO Class
₹ 50,000/- (INR)(8k Group Class)
Duration
150.0 Hrs 6 Months
Lectures
120-150
Batch Size
One or 12
Language
English / Hindi
Skill Level
Beginner to Expert
Mode
Online Live
Certificate
Yes
